

JUBAP.EU · TECHNICAL ANNEX 01 · VERSION 2026-08-14 DRAFT 02
Car Evolution Mobility Operating System
A mobility orchestration layer for cities, campuses, resorts, airports, industrial parks, mobility operators and regions that need to coordinate transport capacity they already have.
Section 01
Purpose
This annex defines the current Car Evolution Mobility Operating System as a product architecture.
Car Evolution is not presented here as a consumer app, a dashboard or a research concept. It is a mobility orchestration layer for cities, campuses, resorts, airports, industrial parks, mobility operators and regions that need to coordinate transport capacity they already have.
The product addresses a practical mobility problem:
People, fleets, public transport operators and authorities make mobility decisions at the same time, in the same territory, but usually without a shared operating layer.
Car Evolution provides that layer: it converts demand, available capacity, policy constraints, scenario weights and live execution feedback into coordinated operating decisions.
Section 02
Product boundary
The current product claim is the orchestration/control capability.
It includes:
- mobility demand and capacity modelling;
- modular policy and restriction modelling;
- scenario weighting and comparison;
- route, service and capacity planning;
- route sheets and execution instructions;
- live operational feedback;
- affected-subspace replanning;
- KPI and governance reporting;
- integration through existing client/operator channels where available.
It does not require OÜ JUBAP or the client to own vehicles. It does not require a city to provide every citizen’s full agenda. It can work with different levels of data detail: individual commitments where authorised, or consolidated/aggregated demand where that is more appropriate.
Advanced user, contract and economic modules are treated separately in Annex 5. They extend the product but should not be confused with the existing orchestration core.
Section 03
Capability status labels
Every capability should be read with one of these states.
Implemented at least once in the historical operational orchestration system or evidenced by source/functionality material. It may still require modernization and adaptation for a new deployment.
Implemented with an external provider, source system, data import or operating channel in the historical material. A target deployment may use equivalent providers.
Productization work needed for a specific city, fleet, operator, data model, workflow, legal context, KPI set or channel.
A bounded module around the core, treated in Annex 5: user-facing layer, carpooling add-on, edge agentic assistant, negotiation, dynamic pricing, contracts, settlement, payments and flexible public-transport modules.
Future extension work, treated outside the product claim.
Section 04
What the system does
Car Evolution turns mobility demand and available transport capacity into coordinated operating plans.
It supports decisions such as:
- when users should leave to improve arrival confidence;
- which routes, stops, pickup sequences or departure windows should be used;
- where capacity should be reinforced;
- when taxis, VTC, partner fleets, shuttles or reserve units should be relocated;
- when carpooling access or shared-trip incentives should be activated;
- which zones, corridors, gates or points of interest should be opened, restricted or prioritised;
- which vehicle classes, emissions labels or service types should receive priority;
- which scenario best balances punctuality, congestion, CO2, cost, accessibility and policy compliance;
- which part of a disrupted plan should be repaired without recalculating the full network.
This is the distinction from monitoring. A dashboard shows a condition. Car Evolution turns the condition into candidate actions, compares their effects and produces operating instructions through channels the client already controls or can reasonably activate.
Section 05
Stakeholder outcomes
5.1 · Citizens and mobility users
The user outcome is confidence, not merely information.
- expected arrival confidence;
- recommended departure time;
- suggested route, itinerary or journey plan;
- weekly or repeated-trip transport-cost visibility;
- practical alternatives before and during disruption;
- alerts and rerouting when the user is subscribed or reachable;
- reduced uncertainty when different modes are involved;
- clearer trade-off between cost, time, sharing, walking, detour and arrival risk.
ExistingAdaptation for arrival-time, route, status and operational logic
PoC / Extension for the full edge agentic user layer, calendar import, behaviour learning and consent dialogue
5.2 · Authorities and mobility governance
The authority outcome is executable policy.
- policy by zone, corridor, gate, stop, point of interest or event perimeter;
- policy by time window, day type, event state or disruption state;
- policy by vehicle type, subtype, tag, provider, emissions label or user class;
- scenario comparison before activation;
- dynamic allocation of transport resources;
- access windows such as carpool-only, low-emission priority or accessibility exceptions;
- public transport reinforcement toward a corridor or zone;
- taxi/VTC/fallback-provider positioning;
- secondary-effect analysis: waiting time, congestion, extra capacity, cost, emissions estimate and policy compliance.
ExistingAdaptation for policy, weighting, scenario and control logic; Adaptation for local legal, enforcement, data and communications channels
5.3 · Fleets, operators and existing platforms
The fleet/operator outcome is reliability across agents.
- route and schedule confidence for clients;
- demand-capacity planning before peaks;
- better use of existing capacity;
- route sheets and operating instructions;
- coordinated fallback when one provider cannot absorb disruption;
- KPI reporting by provider, route family, zone, vehicle type or time window;
- integration with fleet-control, dispatch, booking, AVL/GPS, mapping or operational systems.
ExistingIntegratedAdaptation depending on the target stack
Section 06
Core architecture
The product can be read as a ten-layer operating loop.
| Component | Technical role | State | |
|---|---|---|---|
| 1 | Mobility commitments and demand | Origin/destination, pickup windows, arrival targets, service class, accessibility, recurrence, waiting and detour tolerance. | ExistingAdaptation |
| 2 | Available capacity | Public transport, buses, shuttles, institutional fleets, corporate mobility, taxis/VTC, carpooling capacity, shared vehicles, voluntary private participants and reserve providers. | ExistingAdaptation |
| 3 | Demand grouping and abstraction | Allows operation from individual commitments or from consolidated demand such as OD matrices, cohorts, corridors, events, ticketing, parking demand or operator forecasts. | Existing methodologyAdaptation |
| 4 | Modular policy engine | Rules by vehicle class, emissions label, service type, provider, zone, micro-zone, corridor, gate, point of interest, time window, user class, preference level and exception. | ExistingAdaptation |
| 5 | Scenario and weighting engine | Compares punctuality, cost, CO2 estimate, congestion, occupancy, directness, extra capacity, access policy, fairness, accessibility and other KPIs. | ExistingAdaptation |
| 6 | Governance and selection | Makes trade-offs explicit so an authority/operator chooses a named operating scenario rather than receiving a hidden algorithmic result. | ExistingAdaptation |
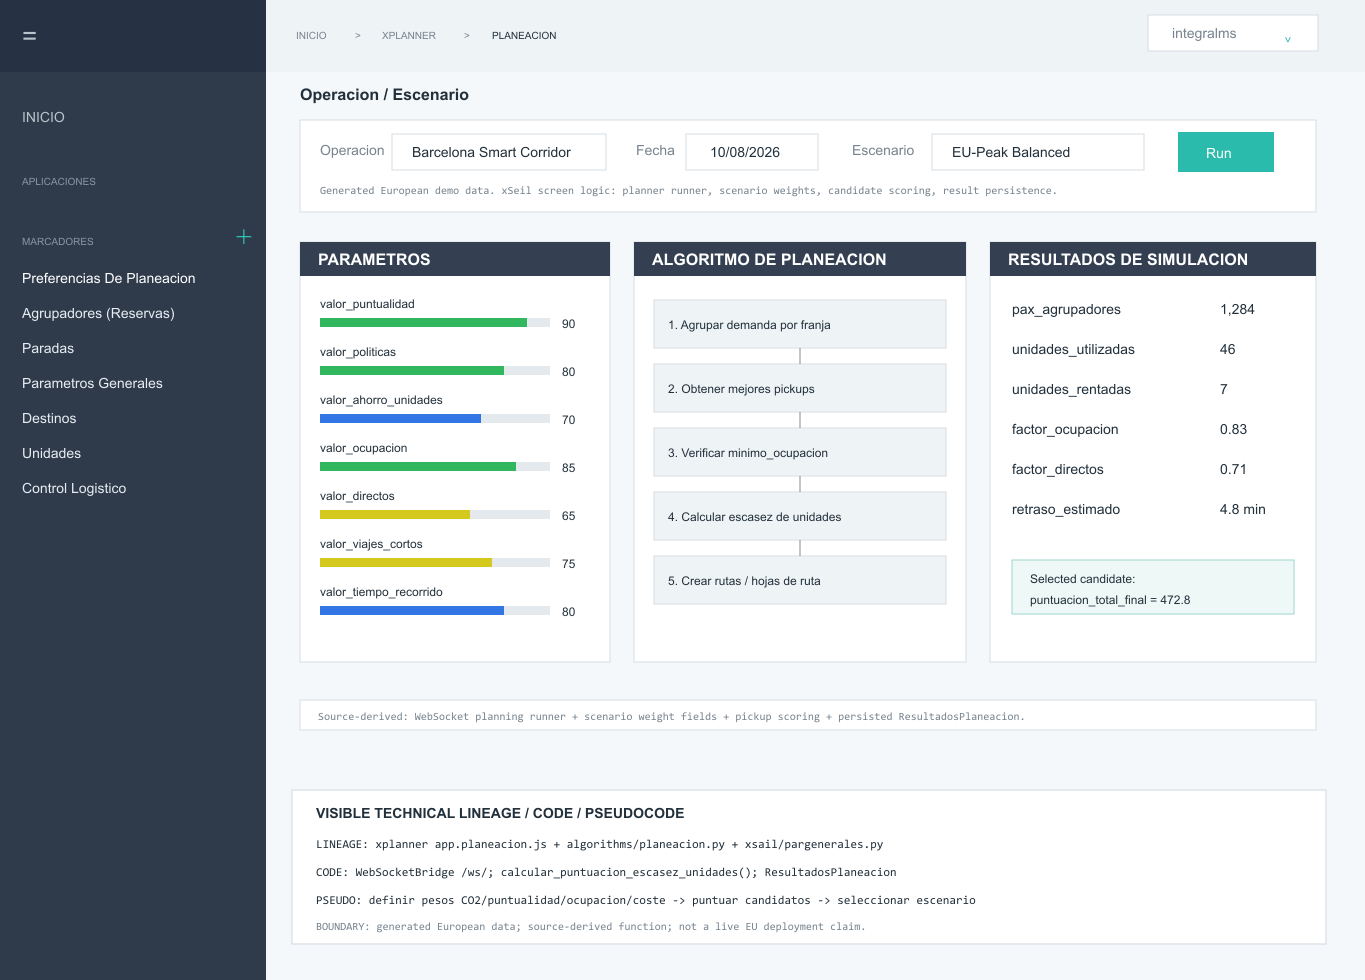
| 7 | Instructions and route sheets | Produces route sheets, departure windows, pickup/drop-off sequences, vehicle/provider assignment, access permissions, alerts and fallback actions. | Existing |
| 8 | Channels and integration | Sends decisions through dispatch, mobile views, municipal apps, APIs, fleet systems, control rooms, manual procedures or approved provider channels. | IntegratedAdaptation |
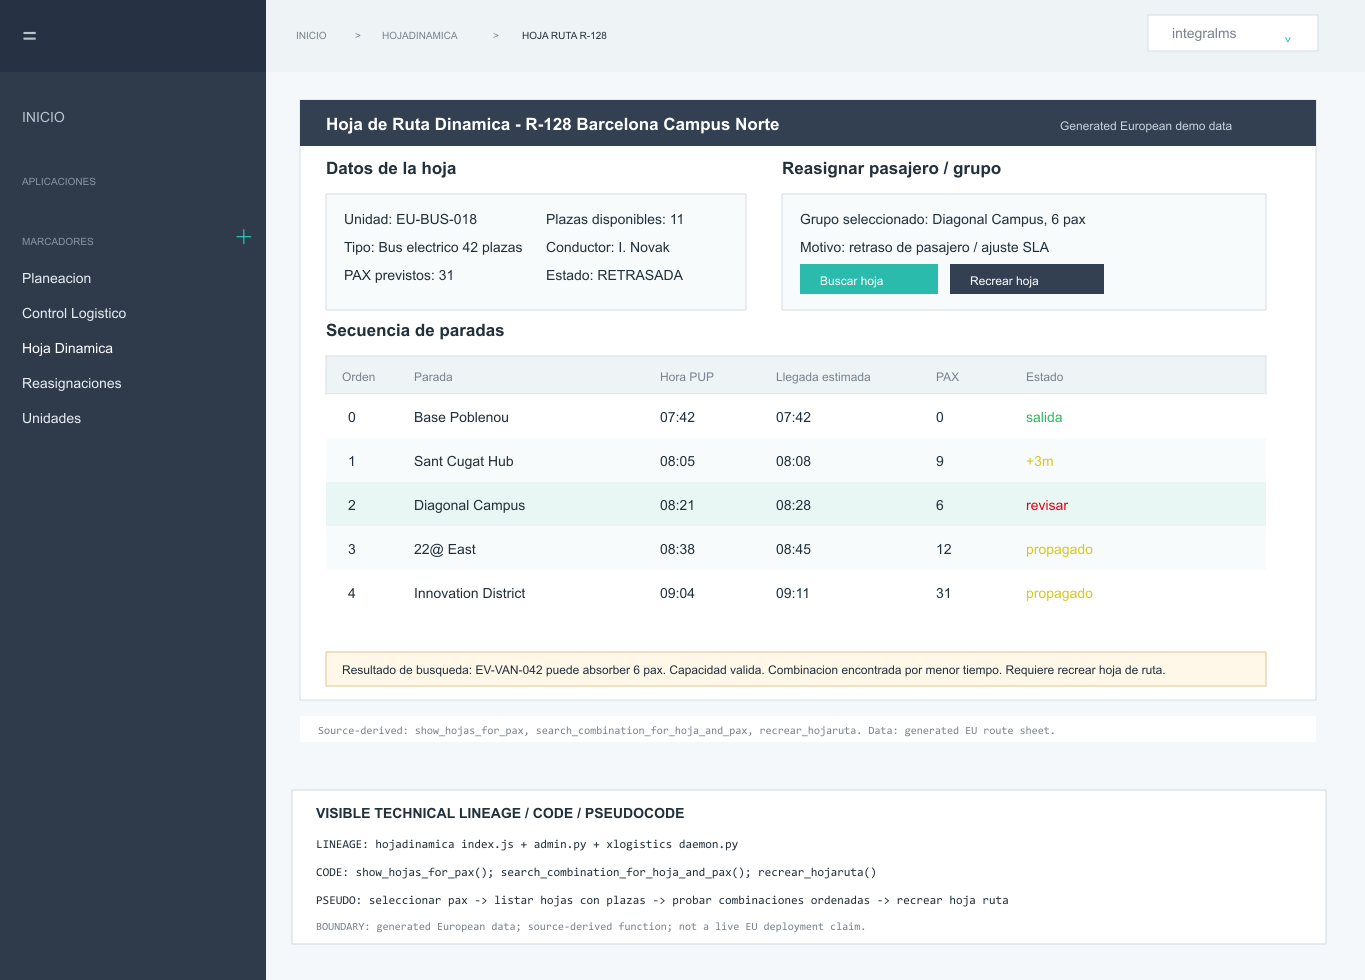
| 9 | Live execution and reality loop | Captures executed and non-executed trips, no-shows, go-shows, boarded passengers, delays, cancellations, vehicle failures, demand changes and incidents. | ExistingAdaptation |
| 10 | Controlled replanning | Preserves feasible parts of the plan and recomputes only affected routes, groups, vehicles, providers, zones, resources or time windows. | ExistingAdaptation |
Section 07
End-to-end operating flow
The operating flow is simple enough for an urban mobility team to read, but it preserves the real control logic: baseline reconstruction, scenario weighting, capacity-gap estimation, route-sheet style instructions, operational truth and bounded replanning.
- 01The system first reconstructs the usable operating baseline: demand, schedules, known peaks, events, service obligations and policy constraints.
- 02It maps the capacity already available or activatable: public transport, fleets, taxis/VTC, shuttles, carpooling, partner capacity or reserve vehicles.
- 03Policies convert public and operator priorities into executable constraints by zone, time, vehicle class, access rule, exception and service level.
- 04Before execution, the system estimates pressure and capacity gaps so the authority can see whether extra capacity or reinforcement may be needed.
- 05Candidate scenarios are generated and scored under the selected weights: punctuality, directness, cost, CO2 estimate, congestion, accessibility and policy compliance.
- 06The authority or operator selects an accountable operating plan. The trade-off is visible.
- 07The plan becomes instructions: route sheets, departure windows, vehicle/provider assignment, access permissions, alerts, reinforcement or relocation actions.
- 08Execution uses available channels instead of requiring replacement of every existing system.
- 09The system reads operational truth: what was executed, not executed, delayed, cancelled, overloaded, newly requested or disrupted.
- 10If the plan still holds, KPIs are recorded and monitoring continues. If reality breaks part of the plan, only the affected subspace is repaired and new instructions are issued.
Section 08
Data model and inputs
Car Evolution can start with imperfect but useful data. A smart-city deployment does not need to wait for universal instrumentation.
Possible inputs:
- OD matrices;
- recurring journey patterns;
- campus, school, employer or event demand;
- ticketing and booking records;
- parking and access-control signals;
- operator forecasts;
- fleet position and availability;
- planned and actual service status;
- public transport schedules and disruptions;
- voluntary user commitments;
- mobility-platform records;
- traffic, weather, event and incident data where available.
The level of granularity is a deployment choice. Some deployments may use individual commitments; others may begin from corridor, zone, cohort or aggregated demand.
Section 09
Policy and constraint model
Policies are modular and combinable.
Examples:
- only shared or carpooling vehicles may access a zone between 07:30 and 09:30;
- a low-emission vehicle class receives priority in a corridor;
- a public transport corridor is reinforced today because demand has shifted;
- taxis/VTC or fallback providers are moved toward an expected demand hotspot;
- a restriction excludes accessibility, emergency or special-permit services;
- an event perimeter distributes flows across several access points;
- a campus or industrial park activates different rules for staff, visitors and providers;
- a route may leave a standard pattern only within a defined tolerance;
- private participating vehicles are routed away from a saturated area where channels exist.
Policy can be defined by
| Geography | city, district, micro-zone, corridor, gate, stop, station, point of interest |
| Time | window, day type, season, event, disruption state |
| Actor | public transport, taxi/VTC, fleet, shuttle, shared vehicle, private participant, accessibility service |
| Vehicle | class, subtype, emissions label, occupancy, capacity, provider tag |
| User / service | passenger class, priority, accessibility need, exception category |
| Action | permission, restriction, warning, incentive, charge, fallback or reinforcement |
Section 10
Scenario and KPI system
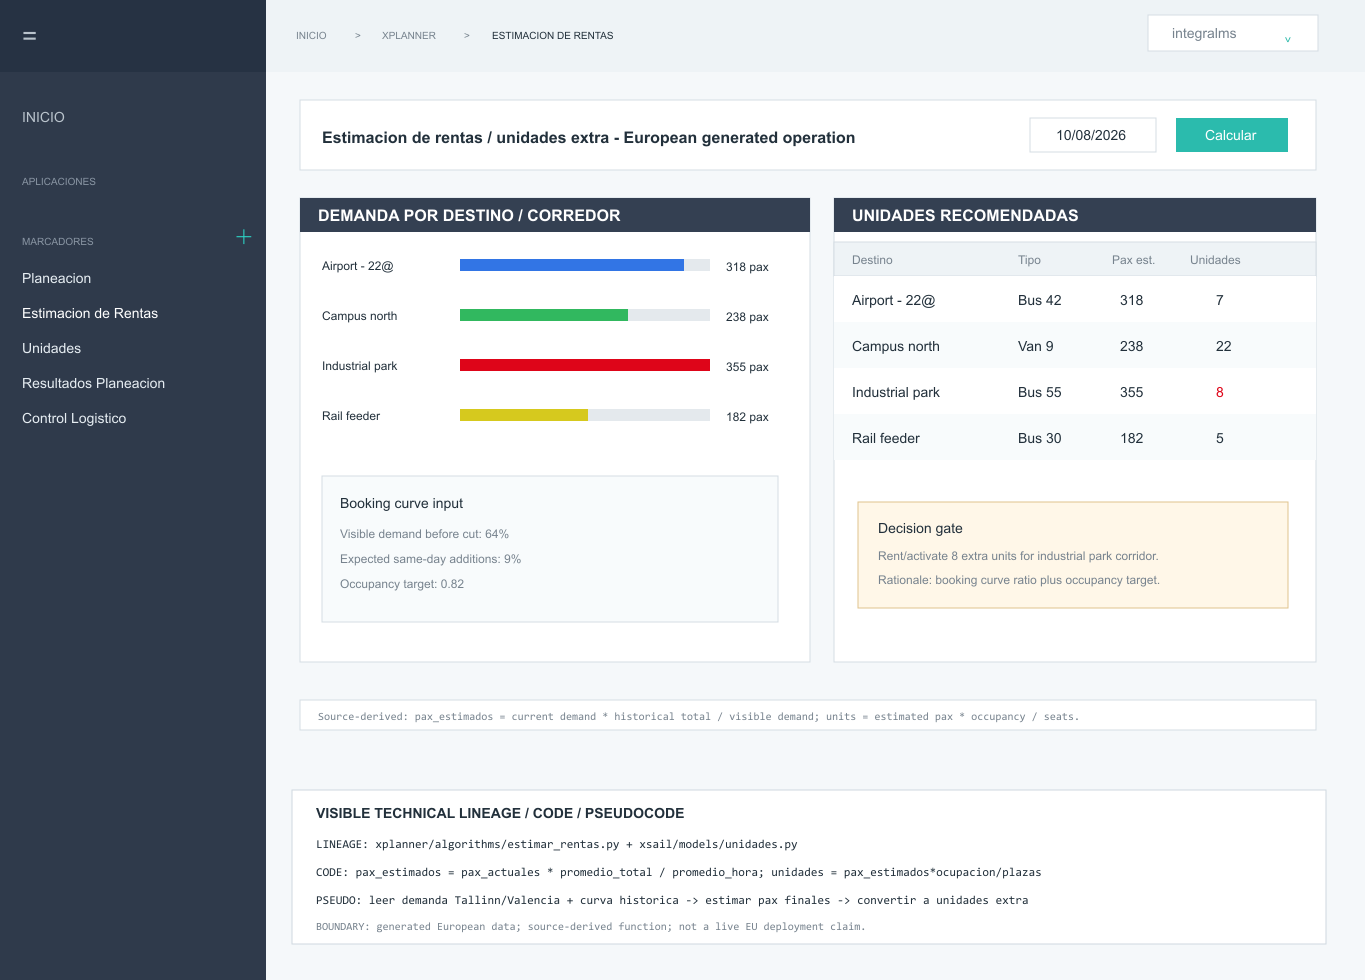
The KPI system is modular and hierarchical. New KPIs can be added and linked to local policy objectives.
Core KPI families
- punctuality and arrival confidence;
- travel time and waiting time;
- congestion ratio;
- directness and route-standard departure;
- occupancy and capacity utilisation;
- extra-capacity need;
- cost by provider, route family or scenario;
- CO2 / fuel / vehicle-km estimate;
- policy compliance by zone, vehicle type, provider or time window;
- accessibility and maximum disadvantage limits;
- resilience after disruption;
- operator efficiency and schedule reliability.
Scenario examples
- reduce CO2 while accepting a small increase in waiting time;
- improve punctuality by activating reserve vehicles or taxis;
- reduce congestion with fewer access restrictions by moving demand to carpooling;
- protect accessibility while applying stricter solo-driving restrictions elsewhere;
- reinforce public transport today in one corridor with changed resources toward that zone;
- keep more routes direct while accepting a higher capacity requirement;
- minimise extra units while allowing slightly longer detours;
- compare all combinations of policy, capacity, cost, punctuality and emissions weights that the authority chooses to test.
Section 11
Execution and integration
The product is designed to sit above existing systems. It can coordinate without replacing every local platform.
Execution channels may include:
- fleet-control systems;
- dispatch tools;
- route sheets;
- driver or operator mobile views;
- municipal or transport-authority apps;
- carpooling platforms;
- APIs;
- access-control systems;
- SMS/email/manual procedures where a low-tech channel is more reliable;
- control-room workflows.
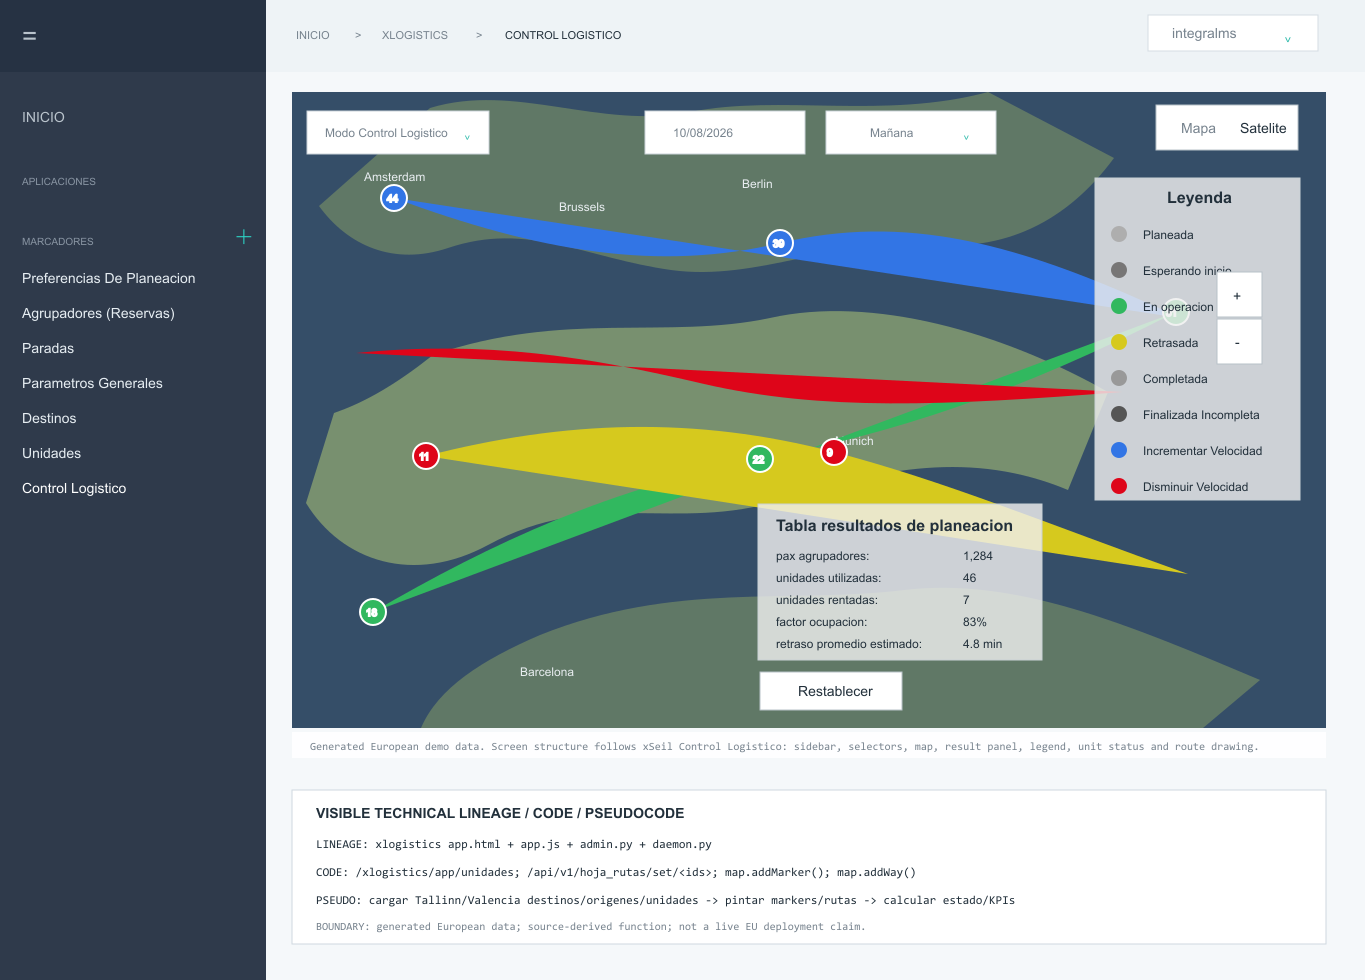
Historical source material shows integration patterns with mapping, telemetry and operational imports. In a new deployment, the equivalent providers are mapped during the local adaptation phase. Examples include Google Maps or another approved GIS layer, GeoTab or equivalent AVL/GPS/fleet telemetry, booking/reservation imports, dispatch systems and operator databases.
Section 12
Product boundary against extensions
The distinction is important for product credibility. This annex defines the Mobility Operating System product core. Advanced user, platform, negotiation, contract and settlement modules are preserved in Annex 5 and should be read there, not folded into this product annex.
Existing / adaptable product core
- central mobility/logistics orchestration;
- scenario planning and weighted trade-offs;
- control-center operating logic;
- route sheets and operational instructions;
- passenger/trip execution states;
- map-based control patterns;
- capacity and extra-unit estimation;
- modular policy and KPI translation;
- partial replanning after disruption.
Section 13
Relationship to the other annexes
| 02 | Historical/source evidence and code-derived proof. It can name the historical systems and show technical evidence. |
| 03 | Research and validation lines, including external research pathways and boundaries. |
| 04 | Alignment with smart-city requirements. |
| 05 | Advanced PoC modules around user layer, carpooling, edge agentic assistants, negotiation, pricing, contracts and settlement. |
| 06 | Planned. Product-fit and competition comparison. |
| 07 | Planned. Commercialization, first commercial steps, distribution and Startup Estonia go-to-market logic. |
This annex is the product architecture baseline. It should be the first technical document reviewed before web copy, investor text or Startup Estonia application language is finalised.